Live on production floors
Know Your Numbers.
Run Tighter Shifts.
SlitForge tracks sets per hour, defects, and downtime in real time — built by a converting professional who spent 12 years on the floor before writing a single line of code.
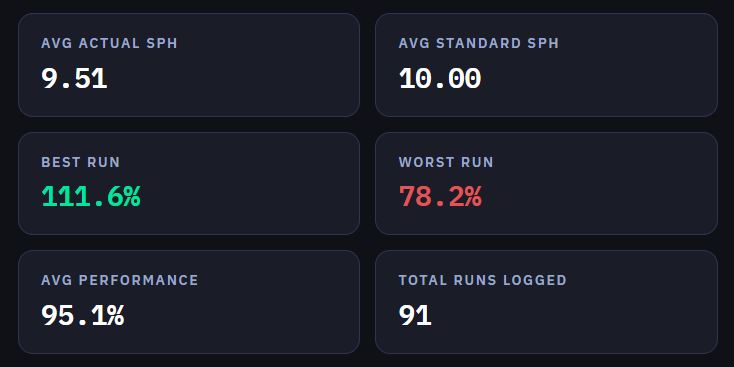
Avg Performance
95.1%
91 runs logged
OEE 91.4%·↑ +3.2% vs last shift
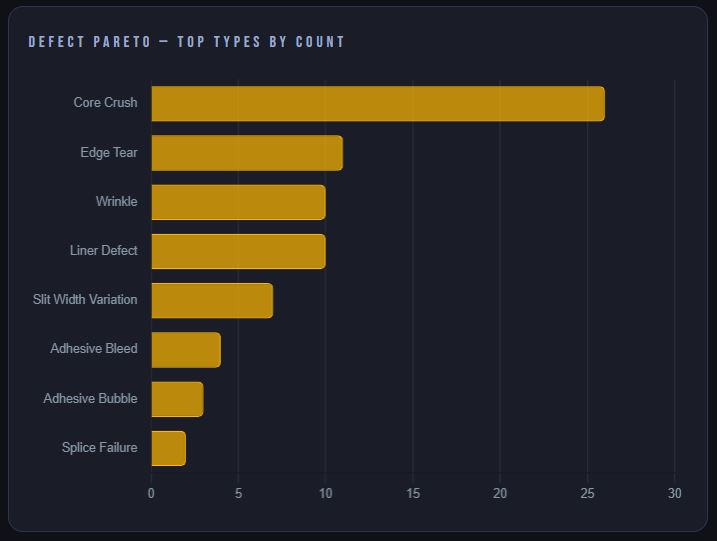
Slit Width Variation·HIGH SEVERITY·Manchester Plant
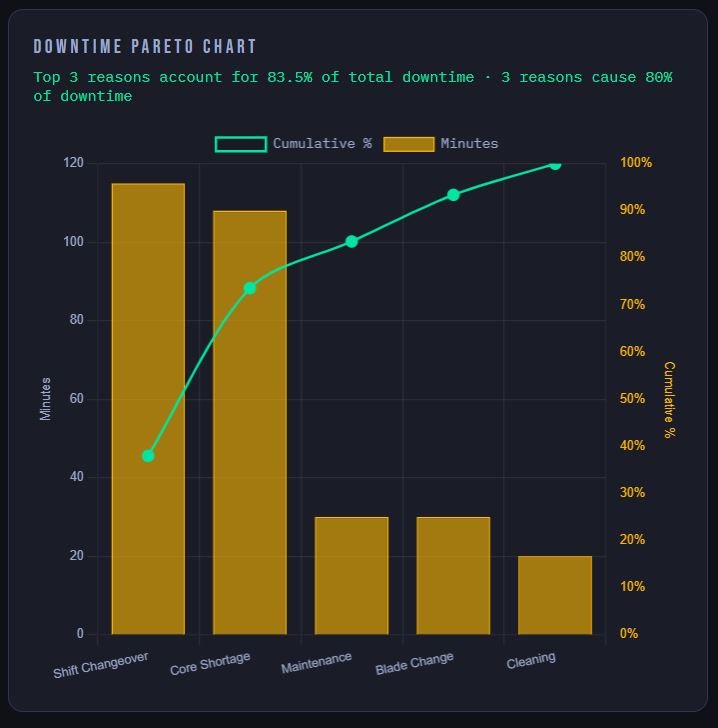
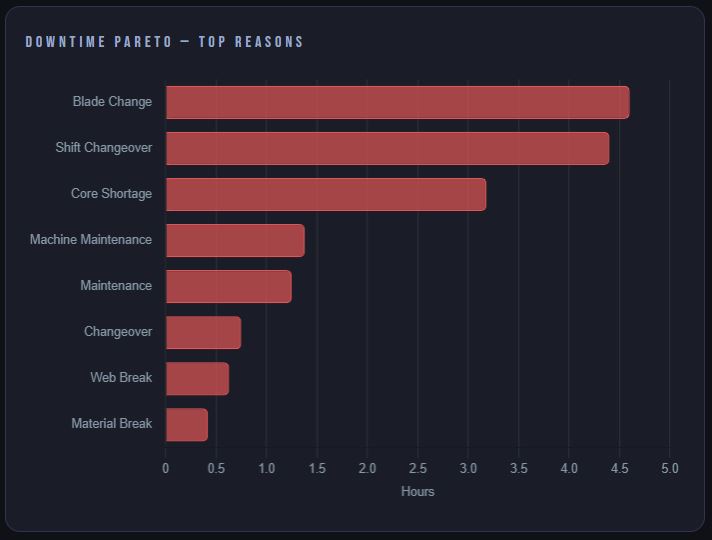
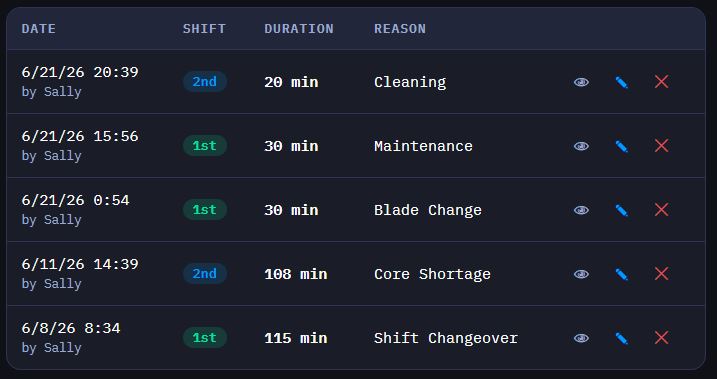
Slitter #2 downtime·42 min·Blade Change·Shift 1
Avg SPH 14.2·Standard 13.5·+5.2% over target
Edge Tear·MEDIUM SEVERITY·Nashua Facility
Rewinder #1 performance·61%·BELOW TARGET
PDF report generated·Defect Analysis Q4·Londonderry Depot
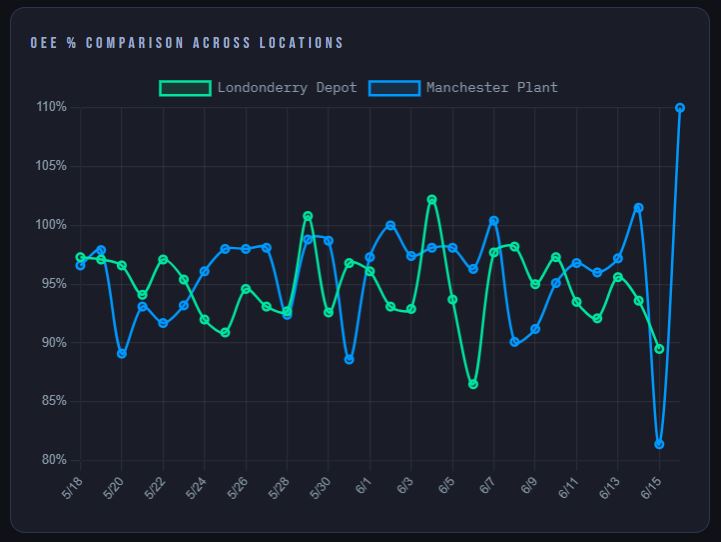
30-day OEE trend·↑ +7.1%·All Locations
OEE 91.4%·↑ +3.2% vs last shift
Slit Width Variation·HIGH SEVERITY·Manchester Plant
Slitter #2 downtime·42 min·Blade Change·Shift 1
Avg SPH 14.2·Standard 13.5·+5.2% over target
Edge Tear·MEDIUM SEVERITY·Nashua Facility
Rewinder #1 performance·61%·BELOW TARGET
PDF report generated·Defect Analysis Q4·Londonderry Depot
30-day OEE trend·↑ +7.1%·All Locations